Population Genetics –
Natural Selection
INTRODUCTION
Charles Darwin (1859) proposed a
mechanism for change through natural
selection which as a result of differential survival and reproductive
fitness leads to evolution of
populations. In the early twentieth
century, naturalists and geneticists were not in agreement on the importance of
the influence of small variations in populations on the processes of natural
selection and evolution. It is now accepted
“doctrine” that populations and
their gene pools are what evolve and
not individuals.
It was in 1908 that this concern for
the impact of gene variation on populations was first addressed by G. W. Hardy
in England and W. Weinberg
in Germany. They both proposed that the process of heredity
(as described by Mendel in 1865) operating in isolation would not alter the
genetic makeup of a population. The Hardy-Weinberg Theory of Genetic
Equilibrium, as it came to be called, says that the proportions of alleles
in a population will stay the same forever.
However, this equilibrium of allele frequencies will be maintained only
if the following conditions are met:
1.
Mating is completely random
2.
Populations are large
3.
Mutations are in equilibrium, i.e. forward events = backward events
4.
There is no migration into or out of the population
5.
All genotypes have equal reproductive fitness (no selection)
In examining the above list, we
immediately recognize that any population that meets these criteria is NOT
going to evolve. Thus, the
Hardy-Weinberg conditions listed above provide guidelines for examining those
circumstances or conditions that lead to changes in allele frequencies and
ultimately to evolution of the population.
HARDY-WEINBERG
IN ACTION
Because populations evolve due to
changes in the gene pool, we can think of the act of producing the next
generation as being the same as taking all the male and female gametes of the
population and stirring them together in a big tub and then handing a certain
number of the newly formed zygotes out to each pair of parents in the
population. By doing this, the pairing
of gametes is a purely random chance set of events that obey the basic laws of
probability. This approach is similar to
the thinking of Hardy and Weinberg.
It is rare that a population in
nature ever meets all of the Hardy-Weinberg criteria in any given
generation. How often do you think that
mating is completely random like our “make believe” of collecting all the
gametes and stirring them together in a tub?
_________________________________________________
________________________________________________________________
Are all
populations large?
______________________________________________________________
Do all
alleles of any gene have the same survival value?
_______________________________________________________________
_______________________________________________________________
EVOLUTIONARY
CHANGE THROUGH NATURAL SELECTION
Under conditions of natural
selection, one phenotype may be favored for survival over another. In our simulation, one phenotype will be
totally selected against in each generation.
Recall the sad plight of the naked bunnies. Breeders of rabbits have long been familiar
with a variety of genetic traits that affect the survivability of rabbits in
the wild, as well as in breeding populations.
One such trait is the trait for furless rabbits (naked bunnies). This trait was first discovered in England by W.E. Castle
in 1933. The furless rabbit is found
rarely in the wild because the cold English winters are a definite selective
force against it. The trait for fur is
dominant to the trait for furless. A
bunny that is born homozygous for this serious recessive condition will die
because it will not survive the English winters. (There are many such hereditary lethal
alleles in the human genome.)
PROCEDURE
1. The white beads will represent the dominant
allele for fur (A). The red beads will represent the recessive
allele for furless (a). The cup will represent the English
countryside, where the rabbits randomly mate.
2. We will imagine that we are setting 50
heterozygous rabbits (Aa) that are
furred loose in the English countryside.
That means that we will have 50 A
alleles and 50 a alleles.
3. To represent this, we will begin the exercise
with 50 white beads (A) and 50 red
beads (a) in the cup. This means that we are beginning with an
allele frequency of 0.5 (50%) A and
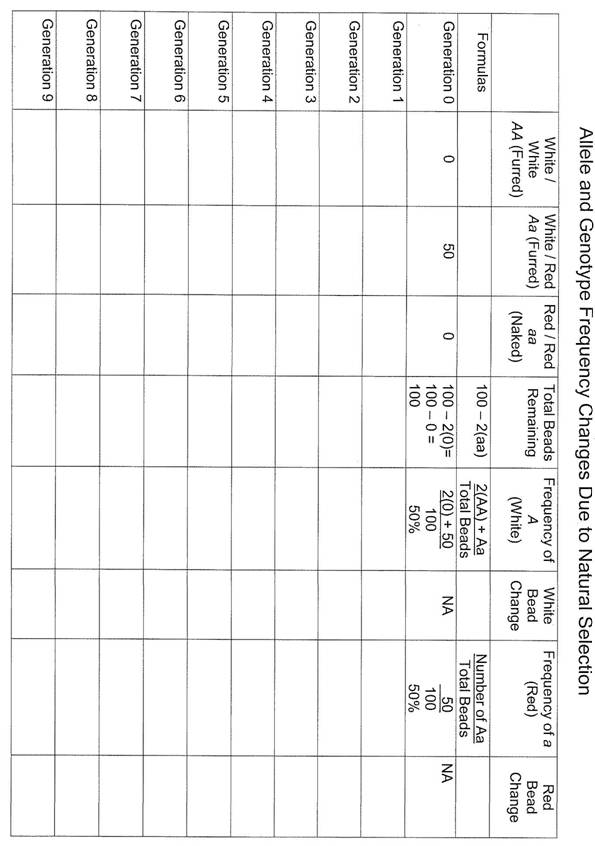
0.5 (50%) a. Record this data in the “Allele and Genotype
Frequency Changes Due to Natural Selection” for Generation 0.
4. Place the beads in the cup and shake up
(mate) the rabbits. You will be
producing Generation 1.
5. Without looking at the beads, select two at a
time to represent a zygote. You will
record this result on the table in the Generation 2 row. If you draw two white beads, you need to make
a tick mark under “White / White”. If
you draw a white bead and a red bead, you need to make a tick mark under “White
/ Red”. If you draw two red beads, you need
to make a tick mark under “Red / Red”.
**We are sampling with replacement, so you will need to return the beads
to your “breeding” cup or gene pool.**
6. Shake the cup again. Without looking, draw two more beads &
record your result on the table. You
will continue this process until you have 50 bead pairs (or baby bunnies).
7. The aa
(or red/red bunnies) are born furless.
The cold weather kills them before they reach reproductive age, so they
can’t pass on their genes. These alleles
are lost to the next generation.
8. We now need to calculate the frequency of
alleles in the survivors of generation #1.
That is the total of the A
(white – furred) alleles among all the AA
and Aa individuals and the total of
the a (red – furless) among the Aa individuals. (Recall, all of the aa individuals were killed by the winter temperatures.)
Example: Let us imagine that you drew 14 AA bunnies, 34 Aa bunnies, and 2 aa
bunnies.
Number of AA individuals = 14 (contains 28 A alleles)
Number of Aa individuals = 34 (containing 34 A alleles and 34 a alleles)
Number
of aa individuals = 2 (contains 4 aa alleles that are lost due to
death)
The total surviving population
contains 28 + 34 A alleles, or 62 A alleles, and 34 a alleles for a total of 96 alleles. The new allele frequencies for Generation 1
will be the progenitors of Generation 2.
This frequency is calculated as…
Frequency of A alleles = 62 / 96 or 65% which = 0.65
Frequency of a alleles = 34 / 96 or 35% which = 0.35
9. Adjust your container by counting out enough
red & white beads to represent the A
and a frequency. In our example, you would count out 65 white
beads (for 0.65 frequency of A) and
35 red beads (for 0.35 frequency of a).
10. Repeat the selection procedure for another 50
bead pairs to produce Generation 2.
Again, record your new frequencies in the table below.
11. Adjust the frequency of the alleles in the
container on the basis of the outcome of the surviving fraction of the Generation 2 and repeat the procedure
again.
12. You will continue this exercise until one of
two things happen…
1)
You produce the ninth, and final, generation of bunnies, OR
2)
Gene fixation occurs. Gene
fixation is the loss of one of your genes (in
other words, you have no
more red beads).
DISCUSSION OF
THE RESULTS OF THE NATURAL SELECTION SIMULATION
1. What did you expect to happen to the
frequency of the two alleles A and a as a consequence of selection removing
the furless offspring? ________________________________________________________________
________________________________________________________________
________________________________________________________________
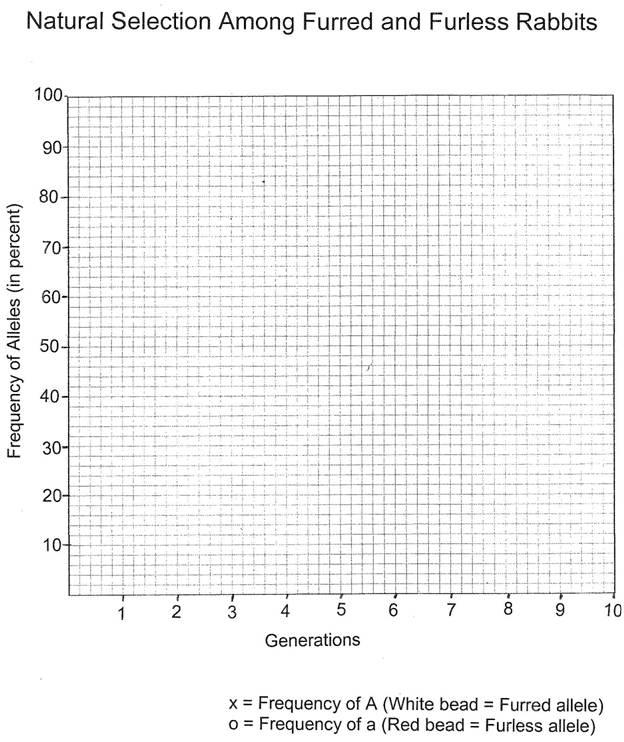
2. On the provided graph paper, graph the change
in frequency of the alleles over the generations and answer the following
questions about the graphed results.
a) Did the frequency change for the two alleles
occur at a constant rate over time?
____________________
b) Was the
change as rapid as you would have predicted?
_____ If not, how would you
describe or explain the observed change in frequency that did occur over
time? ______________________________________________________
________________________________________________________________
________________________________________________________________
c) Based on
your results, what could be postulated about the loss of a deleterious gene
from a population by the process of natural selection?
________________________________________________________________
________________________________________________________________________________________________________________________________