Ecology: Biotic Potential & Overpopulation
INTRODUCTION
The growth of a natural population
of organisms is a consequence of that particular organism’s biotic
potential. Biotic potential is a consequence of reproductive factors that include
age at sexual maturity, number of offspring produced per mating, number of
matings per season, gestational period, nurturing period, & years of
fertility.
Counteracting
biotic potential is a variety of features in the environment that interact to
suppress the growth rate & maximum size of a population. These features include those which are
directly related to the density (#
of organisms per unit of space) and are called density-dependent and others that are in effect regardless of the
density which are known as density-independent.
Some
density-dependent factors are predator/prey ratio, food supply, interspecific
competition for an essential component of the environment, ability of the
environment to absorb the wastes of the population, and the spread of
pathogenic or parasitic organisms within the population. These problems get worse as the population
density gets larger.
Density-independent
factors include climatic changes and available cover as examples. Another example is a forest fire.
All
of these combined make up the environmental
resistance that a population encounters while trying to achieve the
carrying capacity of an environment. The
carrying capacity is the maximum
number of individuals of a particular type that an environment can support
indefinitely.
The
human population was subject to the same factors of environmental resistance as
other natural populations until very recently in the all too short history of
humankind. We can assume that human
beings, as we know them, have been around for at least 40,000 years. During this time, the world population
managed to reach about 400 million by the year 1660. On October 12, 1999, the human population
reached 6 billion. Today it is estimated
that there are 6.6 billion people on earth.
Thus, in less than 4 centuries, the human population has increased
14-fold in numbers over the growth that required nearly 40,000 years to
achieve.
This
has become known as the “population
explosion”, and it is the result of a complex of accomplishments that have
largely removed humankind from the influences of environmental resistance. These accomplishments include (1) becoming
the top predator through the development of firearms, (2) the agricultural
& industrial revolutions, and (3) the medical revolution. The agricultural and industrial revolutions
are vulnerable to failure because they are both built on nonrenewable energy
resources. The medical revolution has no
restraints with respect to its impact on population growth. On the one hand, medicine continues to seek
ways to make all couples fertile & keep all newborns alive, while on the
other, it attempts to provide each human with as many additional years of life
as is possible.
POPULATION
GROWTH
The basic
equation for calculating the growth rate of any population is given by:
Rate of
increase Average
births – Average deaths X existing
In numbers of
=
100 population
Individuals
Thus, if a prairie dog town was
known to contain 900 individuals, and the birth rate was 25 per 100 (25%) and
the death rate was 12 per 100 (12%), then the rate of increase per year would
be (0.25 – 0.12) X 900 = 0.13 X 900 =
117 more prairie dogs per year. At
first, this seems like a phenomenal rate of growth. However, less than 150 years ago, our pioneer
forefathers reported towns of prairie dogs (Cynomys
ludovicianus) that occupied many square miles and contained millions of
individuals!
Of
course this kind of growth will encounter environmental resistance at some
point (recall density-dependent & independent factors). We can include the effect of environmental
resistance in our consideration of population increase by “establishing” a
carrying capacity for our prairie dog environment. When we do this, our equation for determining
the rate of increase in the number of individuals becomes:
Rate of
increase carrying
number of number of
In numbers of =
births – deaths X capacity – individuals X individuals
Individuals 100 carrying capacity at any time
Let us now examine the growth of a
population under more realistic circumstances in which we include the carrying
capacity of the environment. We will use
hypothetical data for the three phases through which any new population passes
as it grows & determine the changes in the “rate of increase in the number
of individuals” as the population progresses through each phase. Solve the above equation for the rate of
increase using the data below.
MONTH POPULATION SIZE
0 Starting size = 20 dogs
Small size =
60 dogs
Small size =
90 dogs
Low middle
size = 200 dogs
Middle size
= 500 dogs
High middle size
= 800 dogs
Low large
size = 1000 dogs
Large size =
1250 dogs
32 High large size = 1450 dogs
To make the
calculations, you will also need the following information:
Growth
rate: 25 births per 100 and 12 deaths per 100 (as before)
Carrying
capacity: 1500 prairie dogs.
Rate of
increase carrying
number of number of
In numbers of =
births – deaths X capacity – individuals X individuals
Individuals 100 carrying capacity at any time
Let us perform
the calculation of the first number of prairie dogs…
Rate of
increase
In number of = (0.25
– 0.12) X 1500 - 20 X 20
Individuals 1500
= 0.13 X 1480
X 20
1500
= 0.13 X
0.99 X 20
= 2.6 dogs increase per unit of time
when there are 20 dogs
Now,
calculate the rate of increase in the number of individuals for the remaining 8
phases from the population data given above & record it in the table below.
Population Size as a Determiner of
Increase in the Number of Individuals
|
Size (# of
dogs) |
Increase |
|
20 |
2.6 |
|
60 |
|
|
90 |
|
|
200 |
|
|
500 |
|
|
800 |
|
|
1000 |
|
|
1250 |
|
|
1450 |
|
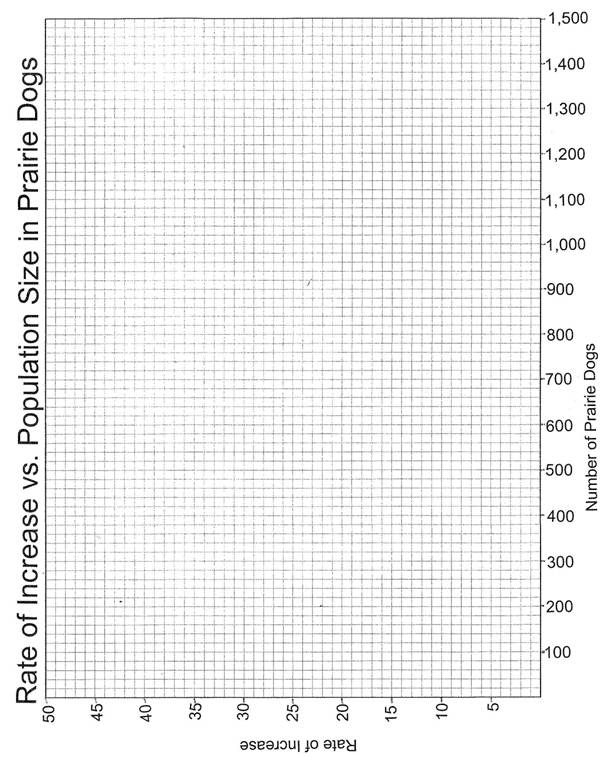
Turn the provided graph paper
sideways & plot the rate of increase versus each size increment. The long horizontal axis (abscissa)
represents the population sizes with one small square equivalent to 20 dogs,
& the short vertical axis (ordinate) represents the increase in number for
each population size with one small square equivalent to 1 prairie dog.
From
your graph, when is the rate of increase the lowest? ________________________________________________________________
The
most rapid?
________________________________________________________________
There is more than one time at which
the rate of increase is slow. Explain
the factors that are involved in causing these two periods of slow
increase. It is important that you
understand the differences in these two situations.
First
situation:
________________________________________________________________________________________________________________________________________________________________________________________________
Second
situation:
________________________________________________________________________________________________________________________________________________________________________________________________
In the previous situation, you
considered the rate of increase in a population as a function of the carrying
capacity. Now let us consider a more
complete circumstance by beginning with a founder population of 20 prairie dogs
that have crossed a dry creek bed due to a temporary dam that was formed by a
mudslide upstream. The area being
populated contains predators consisting of a few foxes, coyotes, and black
footed ferrets.
Use the data provided below to graph
the growth of the population that arises from the 20 founders. The long vertical axis (ordinate) will
represent the population size at any particular time with one small square
representing 20 dogs & the short horizontal axis (abscissa) will represent
time from colonization by the founders with five small squares representing 4
months interval.
|
Months |
Population Size |
|
0 |
20 |
|
4 |
48 |
|
8 |
78 |
|
12 |
262 |
|
16 |
772 |
|
20 |
820 |
|
24 |
844 |
|
28 |
804 |
|
32 |
848 |
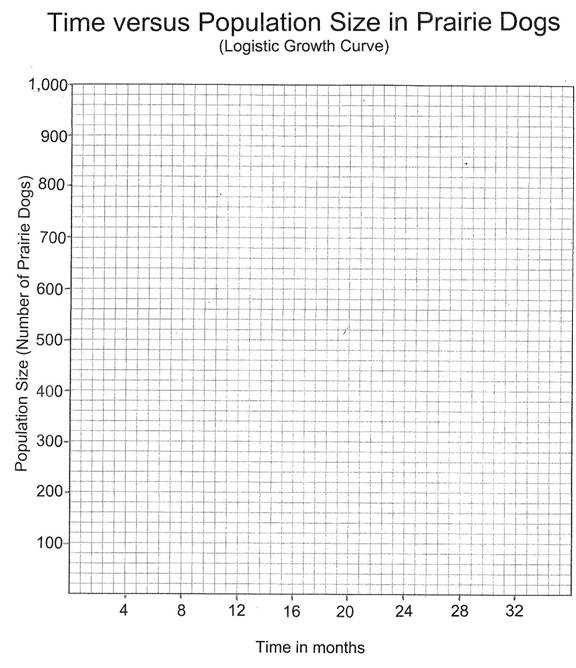
You have constructed a graph of the
logistic growth model. The logistic
growth curve consists of four phases:
lag phase, acceleration phase, deceleration phase, & equilibrium
phase. Label these phases on your graph.
Lag
phase. This phase occurs during
early growth. This initial lag results
from the fact that the organisms need to adjust to their new environment. For example, when a natural mammalian
population is introduced into a new habitat, it takes time for individuals to
locate mating partners. Or when yeast
are introduced into culture tubes, it takes time for new enzymes to be
synthesized before the cells divide.
Acceleration
phase. After the adjustment period,
population size increases more & more rapidly (accelerates). During this phase environmental resources are
essentially unlimited so that the rate of increase is limited only by the organism’s
physiological capacity to survive & reproduce.
Decelerating
phase. As the environment starts to
become saturated with individuals, the rate of growth progressively declines
(decelerates). The rate of growth
declines as the birth rate decreases & the death rate increases. In metazoan populations this occurs, for
example, as the population size becomes so large that individuals start to
compete for space & food. Then
certain females may not get enough food to provide energy for successful reproduction,
or certain individuals may starve to death.
In yeast, the accumulation of waste products may limit growth.
Equilibrium
phase. This final phase is reached
when the environment becomes saturated with individuals. Now a balance (equilibrium) has been reached
between the inherent capacity of the population to increase & the limits
imposed on growth by the shortage of environmental resources or by accumulation
of waste products. By definition,
equilibrium is reached when the birth rate declines to such a point that it
becomes equal to the increasing death rate.